Watching the Dodgers in the middle of August 2026, Shohei Ohtani looked like he was striking out on the same pitch over and over — a slider or a changeup down and away, off the plate, swung at anyway. Stated plainly, the hunch is:
He’s been striking out a lot lately by chasing sliders and changeups away.
Three claims are hiding in there: that he’s striking out more than usual, that the strikeouts come on breaking and offspeed pitches, and that he’s swinging at them rather than taking them. Each one is checkable, and they don’t all survive.
This walkthrough goes from a hitter’s name to an answer in seven steps. The Díaz example runs mostly through the CLI; this one is Python, because the CLI takes a pitcher as its subject and reaches hitters only as a filter (--batter). A hitter-first CLI is on the roadmap. examples/shohei_spin_chase.py does the whole thing in one script.
1. Start from the hitter
Batter is the mirror of Pitcher: pitches() returns the pitches this hitter faced, pulled from the games he played.
from mound import Batter
ohtani = Batter("Shohei Ohtani")
faced = ohtani.pitches(last=40, cache=True)
print(faced)
print(len(faced.games), "games,", faced.to_frame().game_date.min(), "to", faced.to_frame().game_date.max())<PitchCollection to Shohei Ohtani: 617 pitches>
40 games, 2026-06-28 to 2026-08-16Two things about that call. last=40 rather than last=20, because “he’s striking out a lot” is a comparison and needs something to compare against; the second half of this is the recent 20 games, the first half is the 20 before them. And cache=True, because the hitter’s side is expensive: one Savant game feed per game he played, where asking from a starter’s side would be one per start. Forty games is forty requests on a cold cache and none on a warm one.
2. What the last 20 games look like
Savant stamps an at-bat’s result on every pitch of that at-bat, so counting at_bat_result straight from the frame counts a six-pitch strikeout six times. ends_at_bat keeps the one pitch each at-bat finished on, which makes one row per plate appearance.
recent = faced.filter(since="2026-07-25")
plate_appearances = recent.filter(ends_at_bat=True)
print(recent, "\n")
print(plate_appearances.to_frame().at_bat_result.value_counts().head(8))<PitchCollection to Shohei Ohtani: 308 pitches>
at_bat_result
Strikeout 22
Groundout 14
Single 12
Flyout 11
Double 6
Home Run 5
Walk 4
Lineout 3Twenty-two strikeouts in 84 plate appearances, a 26.2% strikeout rate. On its own that number settles nothing: 84 plate appearances is three weeks of baseball, and a rate built on that moves several points on two or three swings. Step 6 puts it next to the previous three weeks, which is the only comparison here that comes from the same data.
3. Which pitch ended each strikeout
The strikeouts are the rows where at_bat_result says so, and pitch_call says how each one ended.
ends = plate_appearances.to_frame()
strikeouts = ends[ends.at_bat_result.str.contains("Strikeout", na=False)]
print(len(strikeouts), "strikeouts in", len(ends), "plate appearances")
print(strikeouts.pitch_call.value_counts())22 strikeouts in 84 plate appearances
pitch_call
swinging_strike 11
called_strike 5
foul_tip 4
swinging_strike_blocked 2Seventeen of the 22 ended on a swing: 11 clean swinging strikes, two on a pitch the catcher blocked, four on a foul tip (a swing that nicks the ball into the mitt, strike three either way). Five were called. That much matches the hunch — this isn’t a hitter getting rung up on the corner.
Now the whole list, sorted by pitch type and location:
print(
strikeouts[["game_date", "pitcher_name", "pitch_type", "velocity", "plate_x", "zone", "pitch_call"]]
.sort_values(["pitch_type", "plate_x"])
.to_string(index=False)
) game_date pitcher_name pitch_type velocity plate_x zone pitch_call
2026-08-16 Logan Henderson changeup 83.0 -1.561891 13 swinging_strike
2026-08-08 Brandon Pfaadt changeup 87.3 -0.336024 13 swinging_strike
2026-08-08 Jonathan Loáisiga changeup 91.3 0.711303 9 foul_tip
2026-08-09 Eduardo Rodriguez changeup 83.7 0.769090 9 swinging_strike
2026-08-01 Payton Tolle curveball 83.6 -1.090767 13 swinging_strike_blocked
2026-07-26 Freddy Peralta curveball 81.0 -0.401860 13 swinging_strike_blocked
2026-07-31 Ranger Suarez four-seam fastball 92.5 -0.931800 13 called_strike
2026-07-29 Emerson Hancock four-seam fastball 96.4 -0.827378 11 swinging_strike
2026-08-11 Michael Wacha four-seam fastball 96.1 -0.641896 4 foul_tip
2026-08-09 Eduardo Rodriguez four-seam fastball 93.1 -0.620316 4 called_strike
2026-08-11 Nate Pearson four-seam fastball 99.4 -0.255746 11 foul_tip
2026-07-26 Freddy Peralta four-seam fastball 94.1 0.250234 12 foul_tip
2026-08-02 Jake Bennett sinker 91.8 -0.849577 13 called_strike
2026-08-12 Daniel Lynch IV sinker 93.6 -0.338815 7 called_strike
2026-07-25 Nolan McLean sinker 95.6 0.727043 3 called_strike
2026-08-13 Shane Drohan slider 88.1 -1.375032 13 swinging_strike
2026-08-15 Aaron Ashby slider 85.3 -0.553687 13 swinging_strike
2026-08-15 Jacob Misiorowski slider 92.5 0.431444 9 swinging_strike
2026-08-02 Tyron Guerrero splitter 92.2 -1.148694 13 swinging_strike
2026-08-05 Shota Imanaga splitter 81.8 0.724318 9 swinging_strike
2026-08-14 Robert Gasser sweeper 82.2 -1.029389 13 swinging_strike
2026-08-05 Tyler Ferguson sweeper 85.6 0.830847 14 swinging_strikeTwenty pitchers for 22 strikeouts, with only Freddy Peralta and Eduardo Rodriguez appearing twice, so this isn’t one arm’s report card. Six of the 22 were four-seam fastballs, and five of those six were called strikes or foul tips: the fastball is finishing at-bats without being swung through. Thirteen were breaking or offspeed pitches, and he swung at all 13.
One column carries most of the answer. zone is Statcast’s numbering as it appears on Savant: 1-9 across the strike zone, 11-14 for the quadrants outside it.
print(strikeouts.zone.value_counts().sort_index())zone
3 1
4 2
7 1
9 4
11 2
12 1
13 10
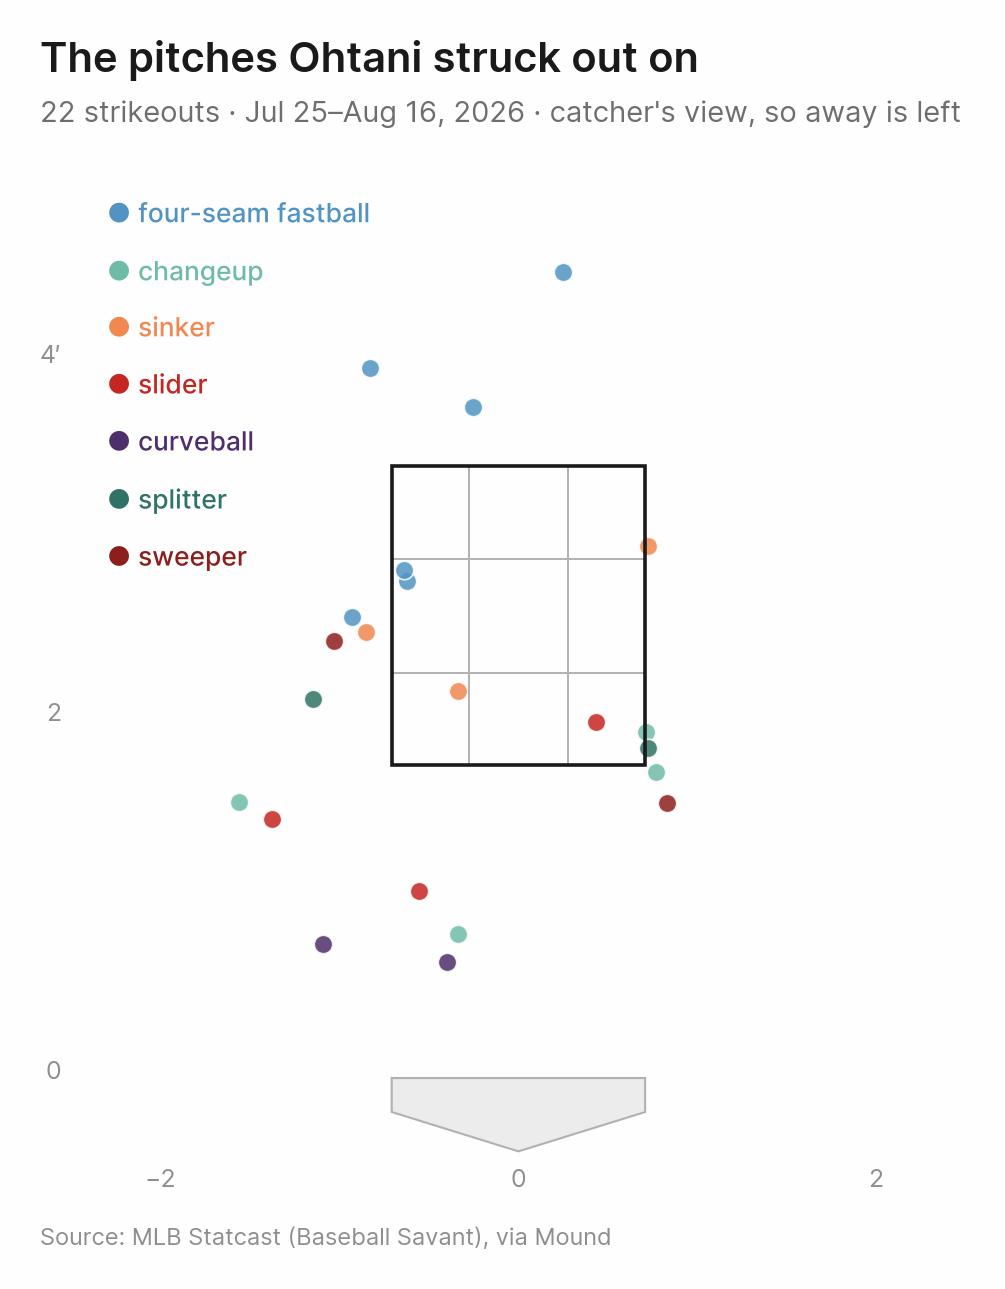
14 1Ten of 22 strikeouts ended in zone 13 alone — one quadrant, the low one on the negative-plate_x side. Fourteen were outside the strike zone entirely.
from mound import PitchCollection
PitchCollection(
[p for p in plate_appearances if "Strikeout" in (p.at_bat_result or "")],
batter=ohtani.player,
).plot_zone(
grid=True,
title="The pitches Ohtani struck out on",
subtitle="22 strikeouts · Jul 25–Aug 16, 2026 · catcher's view, so away is left",
out="ohtani_strikeout_pitches.png",
)
grid=True draws the 3x3 lines inside the zone, which is what makes the cluster below and to the left legible as a place rather than a smear. The fastballs are the three points above the zone and the two in the left-hand column inside it. Everything with spin on it sits low, or off the plate to the left, or both.
4. Which side of the plate is that?
Down is unambiguous. Left is not. plate_x is signed, and nothing in the feed says which sign is the outer half — that depends on which box the hitter stands in, and Ohtani hits left-handed.
The data settles it without a diagram. Ohtani also pitches, and a pitch that hits a batter is on that batter’s side of the plate by definition:
from mound import Pitcher
thrown = Pitcher("Shohei Ohtani").pitches(season=2026, cache=True)
hit_batters = thrown.to_frame().query("pitch_call == 'hit_by_pitch'")
print(hit_batters[["game_date", "batter_name", "batter_stand", "plate_x"]].to_string(index=False)) game_date batter_name batter_stand plate_x
2026-03-31 Angel Martínez L 2.124459
2026-04-28 Agustín Ramírez R -1.806913
2026-05-05 Isaac Paredes R -1.318835
2026-05-27 Hunter Goodman R -2.904604
2026-06-10 Bryan Reynolds L 2.113268
2026-06-17 Yandy Díaz R -2.286874He hit two lefties, at plate_x of +2.12 and +2.11, and four righties between -1.32 and -2.90. So a left-handed hitter’s body is on the positive side, and for Ohtani at the plate, away is negative. In Statcast’s numbering that’s zones 1, 4 and 7 inside the strike zone and 11 and 13 outside it, with 13 the low one.
That makes zone 13 the pitch the hunch described: away, below the zone, off the plate. Ten of the 22 strikeouts ended there.
5. Is he chasing it, or is it just where they throw?
Location alone can’t tell those apart. Chase rate can: swings divided by pitches outside the zone. Split it by which family the pitch belongs to and which side of the plate it went to.
SPIN = ["slider", "sweeper", "slurve", "curveball", "knuckle curve", "changeup", "splitter"]
off_plate = recent.filter(in_zone=False).to_frame()
off_plate["family"] = off_plate.pitch_type.isin(SPIN).map({True: "spin", False: "fastball"})
off_plate["side"] = off_plate.plate_x.map(lambda x: "away" if x < 0 else "in")
splits = off_plate.groupby(["family", "side"]).agg(
pitches=("is_swing", "size"), swings=("is_swing", "sum")
)
splits["chase_rate"] = (100 * splits.swings / splits.pitches).round(1)
print(splits) pitches swings chase_rate
family side
fastball away 53 11 20.8
in 36 16 44.4
spin away 56 25 44.6
in 20 10 50.0Away and off the plate, he lets 79% of the fastballs go and swings at 45% of the spin. Same side, same not-a-strike, twice the swings. That gap is the finding: it isn’t that he’s swinging at everything, and it isn’t that pitchers found a new place to throw. It’s that anything that breaks gets a swing out there and anything straight doesn’t.
Per pitch type, over the same 20 games:
print(recent.chase_rate(by_pitch_type=True).round(1))pitch_type
splitter 100.0
sweeper 54.5
slider 52.6
cutter 46.7
changeup 41.4
curveball 37.5
four-seam fastball 32.7
sinker 13.6Sweepers and sliders out of the zone get swung at more than half the time. The splitter’s 100% is one pitch, thrown once outside the zone and swung at; a rate on a denominator of one is a coin that came up heads. Whiff rates tell the second half of it — changeups 46.4% and curveballs 46.2%, against 25.0% on four-seamers — so the swings out there are also the swings that miss.
Where do pitchers put spin against him? kind="zones" counts it into the same numbering:
recent.filter(pitch_type=SPIN).plot_zone(kind="zones", out="ohtani_spin_zones.png")
Forty-nine of 127 breaking and offspeed pitches went to zone 13, more than the other three outside quadrants combined and more than the whole bottom row of the strike zone. That’s the plan, and it isn’t new: the previous 20 games put 50 pitches in the same cell. What changed is what he did about them.
6. Is any of this new?
The same summary, run over each half of the 40 games. Filtering to zones 11 and 13 is the same thing as away-and-off-the-plate, now that step 4 has settled which side is which.
import pandas as pd
prior = faced.filter(until="2026-07-24")
def summarize(window):
frame = window.to_frame()
ends = frame[frame.ends_at_bat == True]
strikeouts = ends[ends.at_bat_result.str.contains("Strikeout", na=False)]
chased = window.filter(pitch_type=SPIN, zone=[11, 13]).to_frame()
return {
"plate appearances": len(ends),
"strikeouts": len(strikeouts),
"strikeout rate": round(100 * len(strikeouts) / len(ends), 1),
"spin away, off the plate": len(chased),
"swung at": int(chased.is_swing.sum()),
"chase rate there": round(100 * chased.is_swing.mean(), 1),
"strikeouts ending there": int(strikeouts.zone.isin([11, 13]).sum()),
}
print(pd.DataFrame({"Jun 28-Jul 24": summarize(prior), "Jul 25-Aug 16": summarize(recent)})) Jun 28-Jul 24 Jul 25-Aug 16
plate appearances 87.0 84.0
strikeouts 20.0 22.0
strikeout rate 23.0 26.2
spin away, off the plate 63.0 56.0
swung at 18.0 25.0
chase rate there 28.6 44.6
strikeouts ending there 4.0 12.0The strikeout rate barely moved: 23.0% to 26.2%, two extra strikeouts in three fewer plate appearances. That part of the hunch is noise — Fisher’s exact test on 20-of-87 against 22-of-84 gives p = 0.72, which is another way of saying two strikeouts.
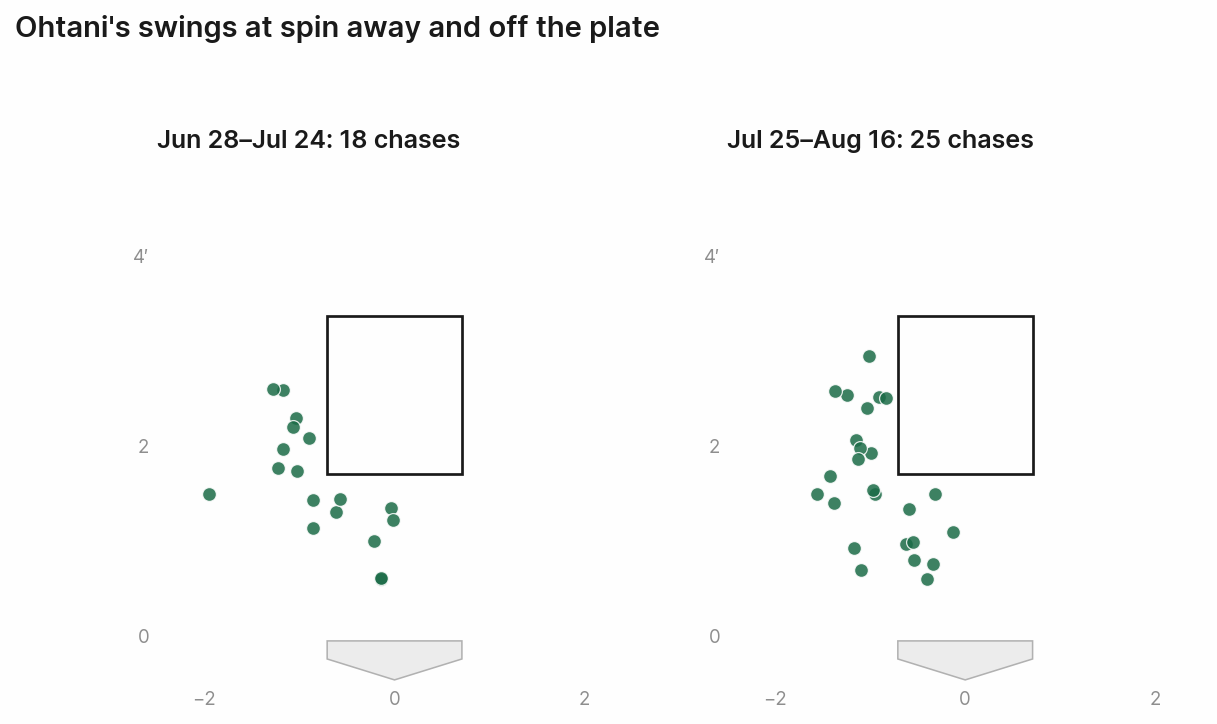
What moved is where they came from. Pitchers threw fewer pitches to that spot, 56 against 63, and he swung at seven more of them, so the chase rate there went from 28.6% to 44.6%. Strikeouts that ended out there went from 4 to 12. In the earlier window he was also striking out swinging — 15 of 20 ended on a swing, against 17 of 22 — but on pitches spread around the zone instead of piled into one quadrant.
prior_ends = prior.filter(ends_at_bat=True).to_frame()
prior_strikeouts = prior_ends[prior_ends.at_bat_result.str.contains("Strikeout", na=False)]
print(prior_strikeouts.pitch_call.value_counts())pitch_call
swinging_strike 12
called_strike 5
swinging_strike_blocked 3The two sets of chases, side by side, using plot_zone’s ax argument to put them in one figure:
import matplotlib.pyplot as plt
from mound.viz import MOUND_STYLE
with plt.rc_context(MOUND_STYLE):
fig, axes = plt.subplots(1, 2, figsize=(9, 5.6))
for ax, (label, window) in zip(axes, (("Jun 28–Jul 24", prior), ("Jul 25–Aug 16", recent))):
chased = PitchCollection(
[p for p in window.filter(zone=[11, 13], pitch_type=SPIN) if p.is_swing],
batter=ohtani.player,
)
chased.plot_zone(ax=ax, color_by=None, title=f"{label}: {len(chased)} chases")
fig.savefig("ohtani_chase_panels.png", dpi=150, bbox_inches="tight")
color_by=None drops the pitch-type colors, so the comparison is about how many points there are and where they sit rather than which pitch each one was.
Be honest about the size of it. Twenty-five swings out of 56 against 18 out of 63 is a 16-point difference with a 95% confidence interval running from roughly -1 to +33 points (Fisher’s exact p = 0.086). Suggestive, not established. The part that’s harder to shrug off is the composition: 12 strikeouts ending in two quadrants where there had been 4.
7. Watch them
Each pitch’s pitch_id is also its play ID on a Savant clip page, so the eight spin-away strikeouts can be pulled as video.
chase_strikeouts = strikeouts[strikeouts.zone.isin([11, 13]) & strikeouts.pitch_type.isin(SPIN)]
print(chase_strikeouts[["game_date", "pitcher_name", "pitch_type", "velocity", "pitch_id"]].to_string(index=False)) game_date pitcher_name pitch_type velocity pitch_id
2026-07-26 Freddy Peralta curveball 81.0 99f88a82-2f81-3a25-9009-9c94bed06962
2026-08-01 Payton Tolle curveball 83.6 8c78b3c5-91ef-325b-8eda-2b712e69bf7d
2026-08-02 Tyron Guerrero splitter 92.2 a175f599-bc2c-349d-a23b-c9773e01f5f0
2026-08-08 Brandon Pfaadt changeup 87.3 1b3d5c35-05f6-33a9-b56d-e0f19af7b8ae
2026-08-13 Shane Drohan slider 88.1 9361b788-e90d-3fbb-9803-a0e6d19fb43b
2026-08-14 Robert Gasser sweeper 82.2 fbcca9dc-d705-3c94-85d6-b25e8c224ef4
2026-08-15 Aaron Ashby slider 85.3 5f3800cb-e843-35a9-a497-4d8d55d92330
2026-08-16 Logan Henderson changeup 83.0 c35be0c6-07e9-3ab3-9c9d-ca15b4dc42camound video-id 9361b788-e90d-3fbb-9803-a0e6d19fb43b --out clips/drohan_slider_aug13.mp4
mound video-id fbcca9dc-d705-3c94-85d6-b25e8c224ef4 --out clips/gasser_sweeper_aug14.mp4Saved clip to clips/drohan_slider_aug13.mp4
Saved clip to clips/gasser_sweeper_aug14.mp4The Aug. 16 changeup is a separate kind of miss: that game had finished an hour before this was written, and Savant hadn’t posted its video yet. VideoNotFoundError covers both a pitch too old for Savant’s coverage and one too new.
One video instead of 21 files
Twenty-two clips opened one at a time is a worse way to watch a pattern than one file that plays straight through. Here are the strikeouts on spin away, back to back, each labeled with the pitch it ended on — seven of the eight, since the Aug. 16 changeup has no clip:
Watching them in a row is the part a table can’t do, though the numbers behind the seven point the same way. All of them crossed off the plate on the outer half, and five crossed below his knees: in inches off the ground, 7, 8, 9, 12, 17, 25 and 29, against a sz_bot of 1.7 feet. The two lowest are both curveballs, from Freddy Peralta and Payton Tolle, and both are recorded as swinging_strike_blocked — down far enough that the catcher blocked the pitch rather than caught it.
examples/shohei_strikeout_supercut.py builds it: a clip per strikeout, the pitch written onto each one, joined in order.
python examples/shohei_strikeout_supercut.py # all 22
python examples/shohei_strikeout_supercut.py --spin-away # just the chases, as above22 strikeouts, Jul 25–Aug 16. Fetching clips:
no clip: Aug 16 Logan Henderson -- No broadcast clip found for pitch_id='c35be0c6-07e9-3ab3-9c9d-ca15b4dc42ca'
21 of 22 clips available
labeling 1/21: Nolan McLean, sinker
...
Saved 21 clips as one video: examples/output/ohtani_strikeouts.mp4That one runs two and a half minutes: all 21 strikeouts, in the order they happened. The label on each clip carries the pitcher, the pitch type in the color the charts give it, the velocity, the zone and how it ended. The card sits bottom-left because MLB broadcasts put their score bug bottom-right; the clip counter goes inside the card rather than in a corner, since which corner holds the network logo changes from broadcast to broadcast.
Watched end to end, it sharpens the split from step 3. The nine strikeouts that ended on a fastball or a sinker were decisions more than misses — eight of the nine were called strikes or foul tips, and their zones are spread around the edges without piling anywhere. All 13 that ended on something with spin were swings, and every one of them crossed below the middle of the zone: eight off the plate away in zone 13, four in the bottom-inside corner, one below the zone and inside.
Mound does the data and the downloads; the stitching is ffmpeg, which the script expects on PATH. Every clip is re-encoded on the way in, because Savant’s clips share a resolution but not a frame rate — some 60, some 120 — and the concat demuxer needs its inputs to agree. Clips are cached in examples/output/clips/ and reused, so a second run only re-stitches. Nothing from that directory is committed to the repo.
What the data says
The hunch is two-thirds right, and the third that’s wrong is the part it led with.
He is not striking out much more than he was: 26.2% against 23.0%, a difference of two strikeouts. But the strikeouts have moved. Twelve of 22 ended on a pitch away and off the plate, against 4 of 20 in the previous three weeks, and 10 of them landed in one quadrant — zone 13, low and away. Seventeen of the 22 ended on a swing.
The mechanism is a swing decision, not a location. Pitchers put spin in that quadrant just as often before, 50 pitches to 49. His chase rate on spin away and off the plate went from 28.6% to 44.6%, while his chase rate on fastballs in the same place stayed at 20.8%. He is picking up the straight ball out there and swinging at the one that breaks.
What this can’t tell you is why. Nothing here separates a timing problem from a swing change from a pitch he’s newly guessing on, and 56 pitches is 56 pitches — the chase difference alone would not clear a significance test (p = 0.086). What the data supports is a narrower claim than the hunch: the strikeouts have concentrated in one quadrant, on one kind of pitch, and he’s swinging at it.
Reproduce it
python examples/shohei_spin_chase.py # the tables and the plots
python examples/shohei_strikeout_supercut.py # the strikeouts as one videoBoth write to examples/output/. The second one needs ffmpeg.
Going further
Which arms did it, and whether any of them did it twice:
chase_strikeouts.pitcher_name.value_counts()Eight strikeouts, eight pitchers, so from the hitter’s side this is a league-wide plan rather than a matchup. To study one arm’s version of it, ask from the pitcher’s side instead — it’s the same pitches from a fraction of the fetches, since a starter appears in a handful of the games a hitter plays:
from mound import Pitcher
Pitcher("Robert Gasser").pitches(season=2026, batter="ohtani", cache=True)Other directions from the same 40 games:
recent.filter(zone=13).swing_rate()againstprior.filter(zone=13).swing_rate()asks the swing-decision question without the pitch-type split.recent.filter(pitch_type=SPIN, zone=[11, 13]).plot_zone(kind="kde")smooths the chase cloud, if 56 points is enough for a shape (it’s borderline).- Swing decisions by count — ahead, behind, two strikes — would separate a chase from a protect-the-plate swing. Mound has
ballsandstrikeson every pitch; the plate-discipline framing on top of them is a roadmap item, not a built-in.
Run it yourself
This walkthrough lives in the repo as docs/examples/ohtani-spin-chase.md, with a runnable companion script in examples/.