Understand every pitch.
Mound retrieves, analyzes and visualizes MLB pitch-level data from the command line or a few lines of Python. Start from a player’s name. No MLB IDs to look up, no undocumented APIs to learn.
$pip install mound$ mound arsenal "Roki Sasaki" --game 825051
pitches usage% strike% whiff% chase% velo spin hb ivb
four-seam fastball 35 40.7 57.1 27.3 6.2 98.8 2427 11.2 16.9
splitter 32 37.2 81.2 13.6 57.9 90.2 868 5.3 1.0
slider 14 16.3 57.1 40.0 33.3 87.1 2099 3.0 0.1
forkball 5 5.8 60.0 50.0 0.0 88.2 758 2.8 -2.0One start, one table. The four-seamer lives in the zone and gets missed when hitters swing at it; the splitter’s whole job is to be chased below it, and it was, 57.9% of the time.
Find answers to questions about a pitcher’s arsenal.
- 01
How many splitters did Roki Sasaki throw against the Diamondbacks last night?
- 02
How often has he thrown it relative to his other pitches over his last four starts?
- 03
What does its location look like over that period?
- 04
How does he attack one particular hitter, and does that hitter chase the splitter?
Mound answers all four with a few CLI commands or a few lines of Python, and it never asks you for an MLB player ID to get there.
A small surface, pointed at one job.
Ten commands, seven of them mirrored on the batter’s side, over two Python objects that share the same implementation underneath. Anything you can do in the shell, you can also do in a script.
mound search "Roki Sasaki"Start from a name
Resolve a player to an MLB ID, accents optional. Every other command takes the name directly, so you rarely need the ID at all.
--last 4 --pitch splitterFilter how you'd ask
Last N appearances, a date range, one game, one pitch type, one batter side, one at-bat, one exact pitch. Filters compose freely.
mound arsenalStuff and results together
Usage and strike rate next to whiff rate, chase rate, velocity, spin and movement, so what a pitcher threw and how nasty it was share one row per pitch type.
mound zone --kind heatmapCharts that arrive finished
A headline, dek and source render around the strike zone. Scatter, heatmap, KDE or Statcast's numbered zones, optionally split into vs-LHB and vs-RHB panels.
--batter perdomoMatchups from either side
Pitcher(batter=...) and Batter(pitcher=...) return the same pitches. Pick whichever player the question is actually about.
mound video --limit 1Broadcast clips, by pitch
Download the video for one pitch, one at-bat or a whole filtered collection, resolved straight from each pitch's own ID.
--cacheA cache that can't go stale
A finished game never changes, so a hit is always good. A game in progress is never written, so tonight's fourth inning never sticks.
--export roki.csvExport anywhere
CSV, JSON or Parquet from the CLI, or to_frame() for a pandas DataFrame with every field the feed returned.
Three angles on “how nasty was it?”
| Pitch | No. | Velo | Spin | Whiff | Chase |
|---|---|---|---|---|---|
| four-seam fastball | 35 | 98.8 | 2427 | 27.3% | 6.2% |
| splitter | 32 | 90.2 | 868 | 13.6% | 57.9% |
| slider | 14 | 87.1 | 2099 | 40.0% | 33.3% |
| forkball | 5 | 88.2 | 758 | 50.0% | 0.0% |
- Swing rate
- Swings over every pitch thrown. How often hitters were tempted at all.
- Whiff rate
- Swings that missed, over swings — Baseball Savant’s own convention, not misses over every pitch. A pitch rarely swung at can still post a high number.
- Chase rate
- Swings over pitches outside the zone. Read from location geometry rather than the strike ruling, because those are genuinely different things.
The morning after, in one command.
One start is the unit people actually ask about. mound outing reports the whole thing — the shape of the outing, how every plate appearance ended, and the arsenal table — instead of running mix, results and arsenal against the same game three times.
$ mound outing "Yoshinobu Yamamoto" --date 2026-08-21
Yoshinobu Yamamoto · 2026-08-21 · vs Pittsburgh Pirates · game 823911
107 pitches · 27 batters faced · innings 1-7 · 64% strikes · 70% first-pitch strikes

Plate appearances
Strikeout     9
Groundout     6
Single        3
Pop Out       3
Hit By Pitch  2
Double        2
Flyout        1
Walk          1

Arsenal
                    pitches  usage%  strike%  whiff%  chase%  velo  spin    hb    ivb
splitter                 32    29.9     75.0    38.1    55.0  90.9  1402  10.7    1.1
four-seam fastball       28    26.2     60.7    45.5    40.0  95.7  2246   8.6   16.2
cutter                   21    19.6     52.4    14.3     8.3  91.5  2466   3.1    8.5
sinker                   15    14.0     60.0     0.0     0.0  95.8  2295  15.1   11.0
curveball                 8     7.5     75.0     0.0     0.0  76.0  2696  11.4  -15.1
slider 3 2.8 66.7 0.0 0.0 85.7 2781 6.8 0.3- mound outing "Yoshinobu Yamamoto"
- The most recent start. The morning-after default.
- --date 2026-08-21
- A particular day, named by opponent in the headline.
- --season 2025
- His last start of that season.
- --game 823911
- An exact game_pk, when you already have one.
What the innings mean. innings 1-7 is the innings he appeared in, not innings pitched. A reliever who enters with two outs still shows up in that inning, and nothing in the feed counts outs, so there’s no honest way to print a box-score line.
And no --last. An outing is one game. A window of several starts is what mix, arsenal and zone are already for.
Charts that arrive finished.
A headline, a dek and a source line render around the strike zone itself, so a plot is publishable the moment it renders. All three are generated for you and all three are overridable.
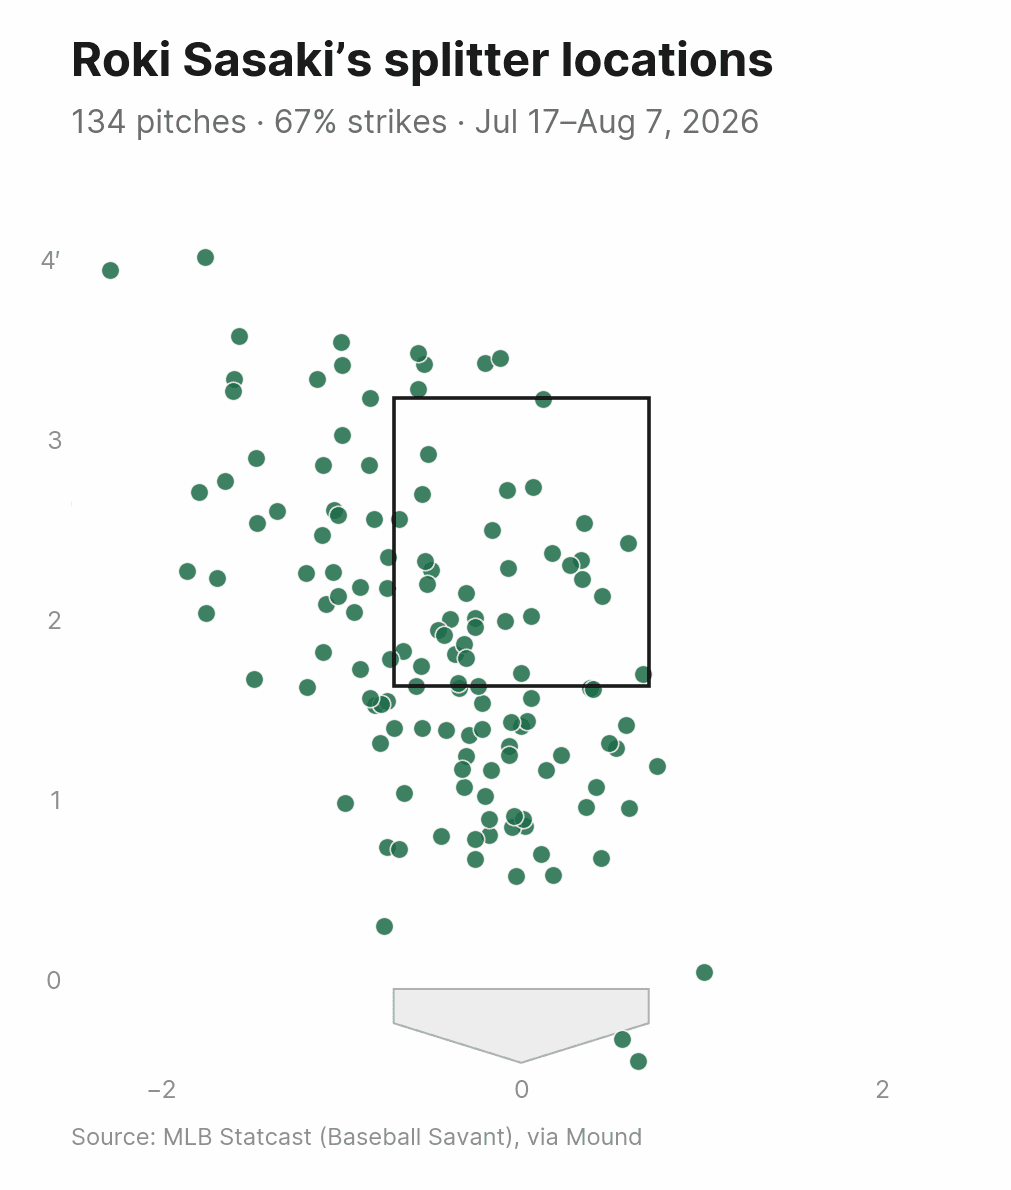
kind="scatter"The default. Points are colored by pitch type when a plot shows more than one, from a palette fixed by pitch name rather than assigned per chart.
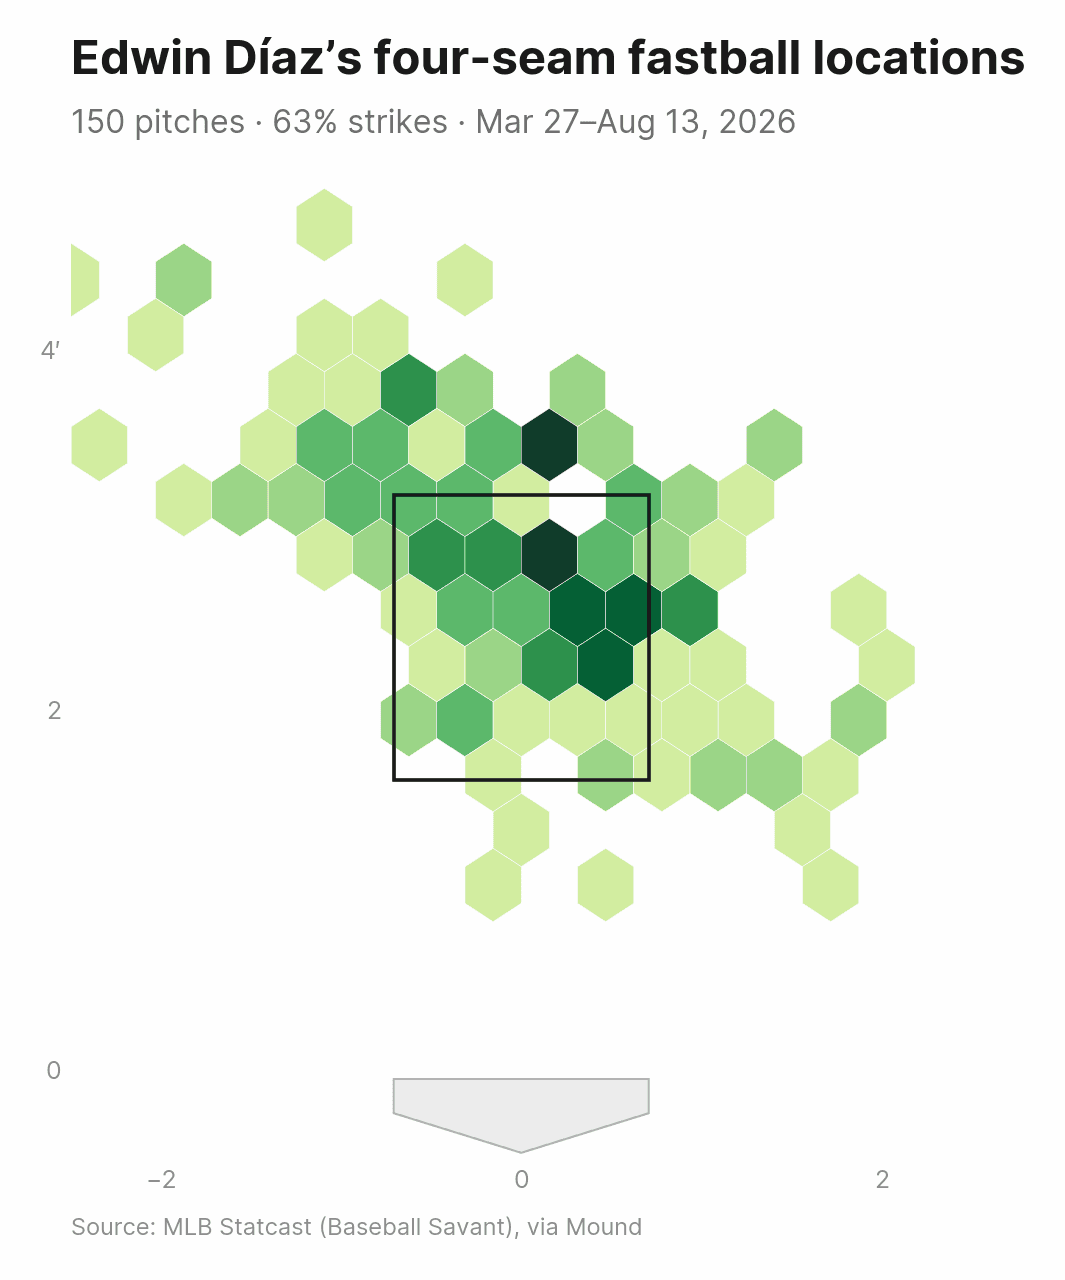
kind="heatmap"Binned density for larger samples. No colorbar — darker means more pitches, and the panel stays aligned with every other kind.
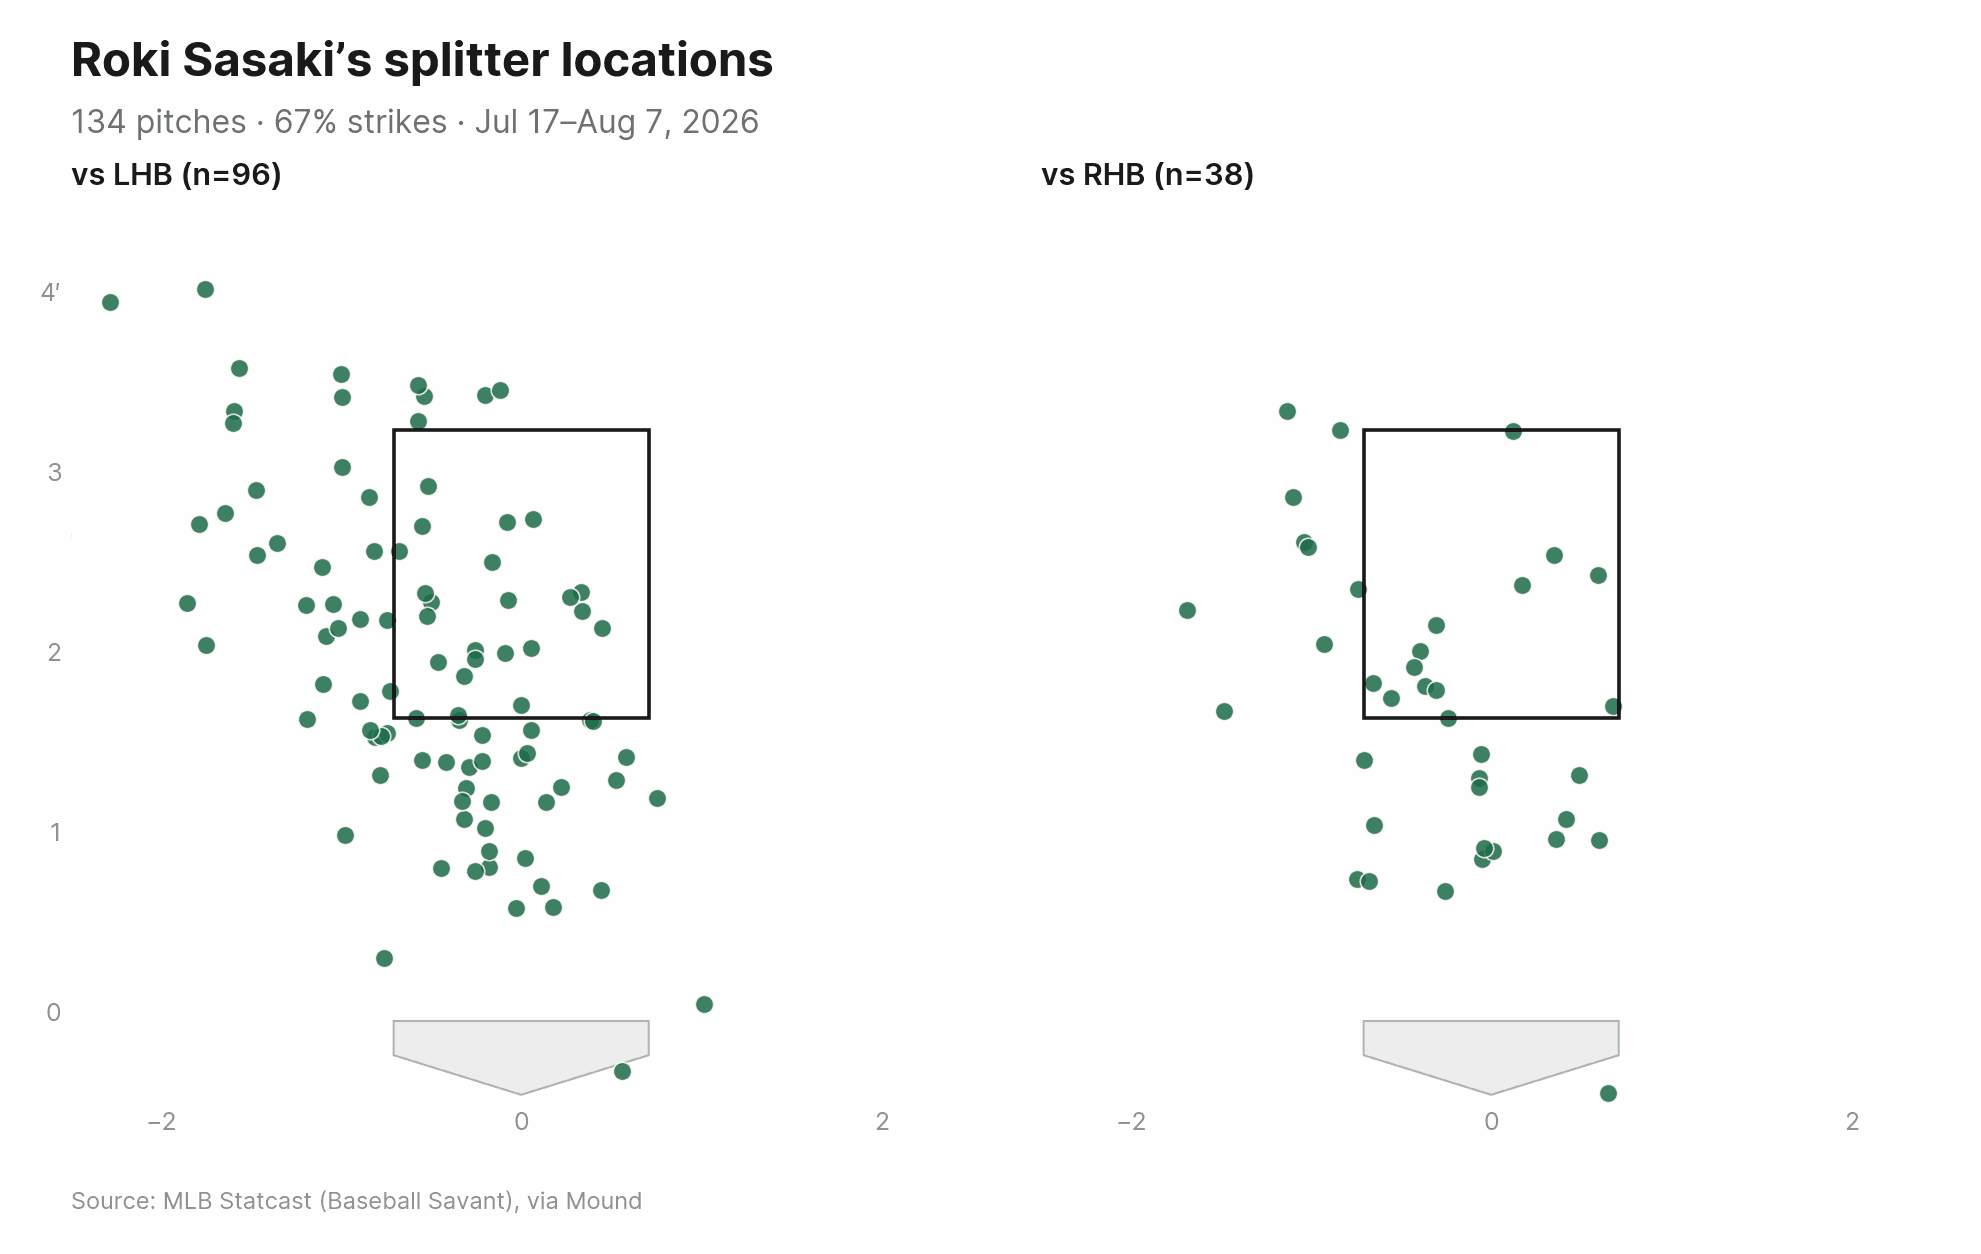
split_by="stand"Location isn't mirrored for handedness, so mixing lefties and righties in one panel blurs the picture. Split it into a pair, each with its own zone and pitch count.
Then watch the pitch that did the damage.
Every pitch carries a pitch_id that doubles as the play ID on a Baseball Savant clip page. Any pitch you can filter to is a pitch you can download.
$ mound video-id a08dfb7d-1acd-3776-a6d8-0f5e80cdb0c6 --out clips/perdomo_triple_aug8.mp4$ mound video-id 13f4b8d1-39f4-3499-b696-8a3311899fde --out clips/carroll_triple_aug8.mp4Geraldo Perdomo Triple
Four-seam fastball, 96.5 mph, middle third of the zone and 0.06 feet off the center of the plate.
Corbin Carroll Triple
Four-seam fastball, 98.6 mph, middle third of the zone and 0.07 feet off the center of the plate.
Back-to-back triples off Edwin Díaz in the ninth at Chase Field on Aug. 8, 2026. Both were four-seam fastballs in the middle third of the zone, less than an inch off the center of the plate. See a full walkthrough example of another blown save by Diaz.
Two minutes to your first pitch.
Install it, point it at a name and start asking. The worked example goes all the way from a pitcher’s postgame quote to the video of the pitches that disproved it.
$pip install mound$mound search "Roki Sasaki"$mound arsenal "Roki Sasaki" --last 4Add pip install "mound[viz]" for KDE heatmaps, or "mound[parquet]" for Parquet export.