Edwin Díaz blamed his fastball. After blowing a save against Milwaukee on Aug. 13, 2026, his third in four appearances for the Dodgers, he said:
“I was throwing my fastball right in the middle. When you miss in the middle, you pay.”
The locations support him. Five of his 15 fastballs finished in the middle third of the strike zone, nearly twice his season rate. Two became singles. But the hits that drove in the runs came on sliders, including one outside the zone.
His explanation fit the start of the rally. It didn’t explain all of it.
Four singles between two strikeouts
Díaz opened the ninth by striking out William Contreras. Then came four consecutive singles before he struck out Gary Sánchez. The fastballs to Joey Ortiz and David Hamilton put runners on; the sliders to Jackson Chourio and Garrett Mitchell brought runs home.
| Batter | Final pitch | Velocity | Result |
|---|---|---|---|
| William Contreras | Slider | 88.9 mph | Strikeout |
| Joey Ortiz | Fastball | 95.9 mph | Single |
| David Hamilton | Fastball | 96.1 mph | Single |
| Jackson Chourio | Slider | 91.1 mph | Single |
| Garrett Mitchell | Slider | 90.0 mph | Single |
| Gary Sánchez | Fastball | 96.8 mph | Strikeout |
That sequence is a useful place to start an investigation with Mound. One command returns the pitch that ended each plate appearance:
mound pitches "Edwin Díaz" --game 823915 --ends-at-bat --cacheThe --ends-at-bat filter matters: Baseball Savant repeats an at-bat’s result on every pitch, so counting those results without the filter would count the same hit several times. Here, six rows describe six hitters.
The inning was part of a rough stretch shortly after Díaz returned from elbow surgery. He blew saves on Aug. 7 and Aug. 8, converted one on Aug. 10, then blew another on Aug. 13. Those were his fourth through seventh appearances back. Across the four outings, he threw 77 pitches.
Where the fastballs went
To check Díaz’s explanation, we need a consistent definition of the middle. Here it means the middle third of the hitter’s strike zone vertically, with the pitch also crossing within the width of the plate. It is a band across the zone, not just the small square at dead center. Each hitter’s recorded zone height sets the boundaries.
On Aug. 13, five fastballs landed in that band. Across his season through that night, 27 of 150 did.
| Fastball location | Aug. 13 | Season through Aug. 13 |
|---|---|---|
| Upper third | 4 of 15 (26.7%) | 30 of 150 (20.0%) |
| Middle third | 5 of 15 (33.3%) | 27 of 150 (18.0%) |
| Lower third | 1 of 15 (6.7%) | 13 of 150 (8.7%) |
| Outside the zone | 5 of 15 (33.3%) | 80 of 150 (53.3%) |
The difference is visible in the locations:
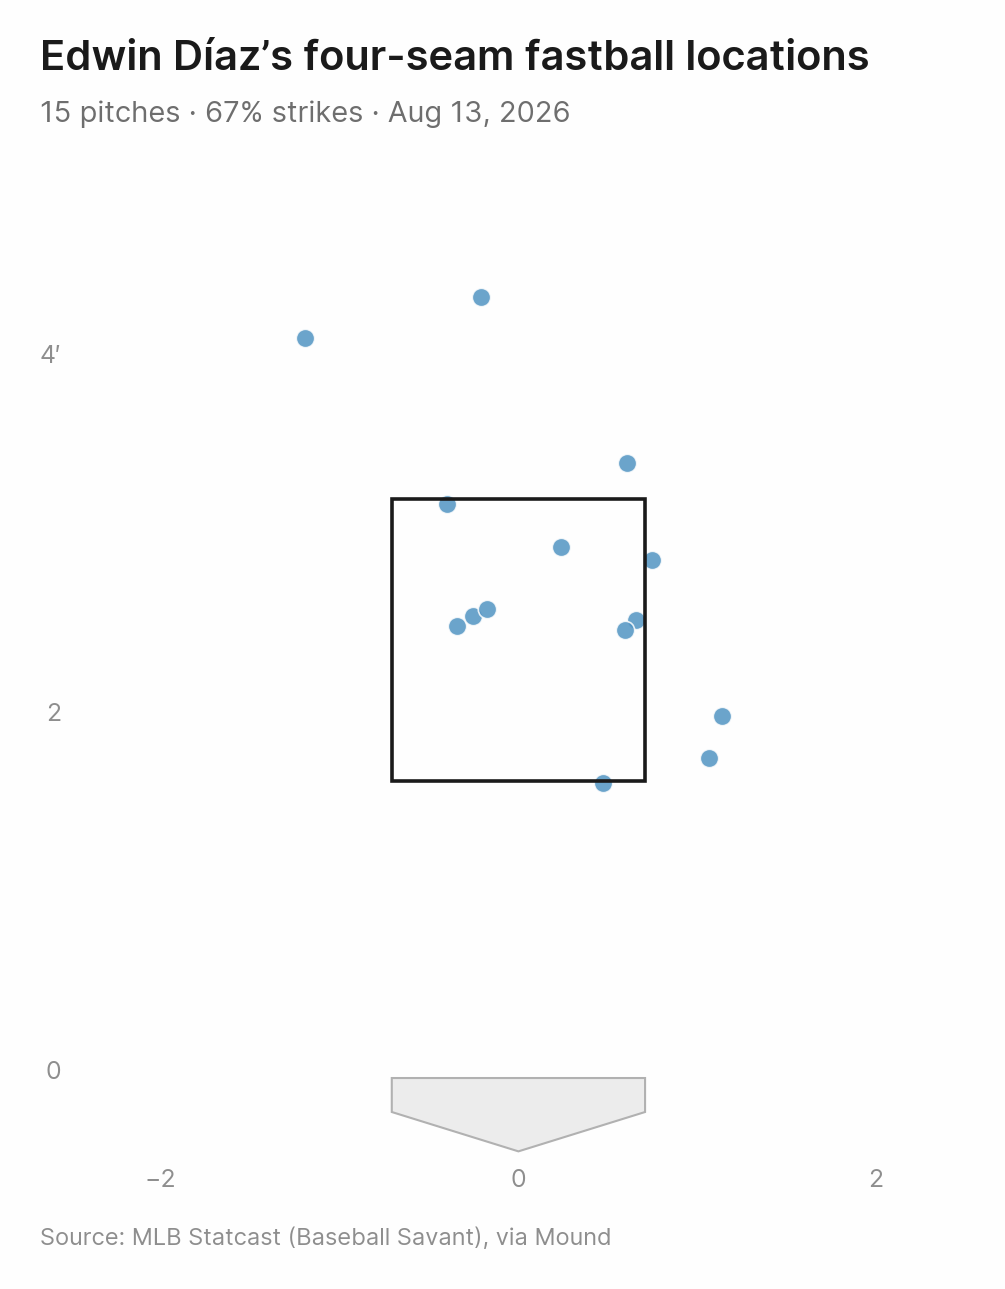
Both fastballs hit for singles were in the middle band. Hamilton’s was about two inches from the center of the plate; Ortiz’s was roughly four inches away. Neither required a hitter to reach above the zone.
The season view shows how often Díaz had worked higher, including above the strike zone:
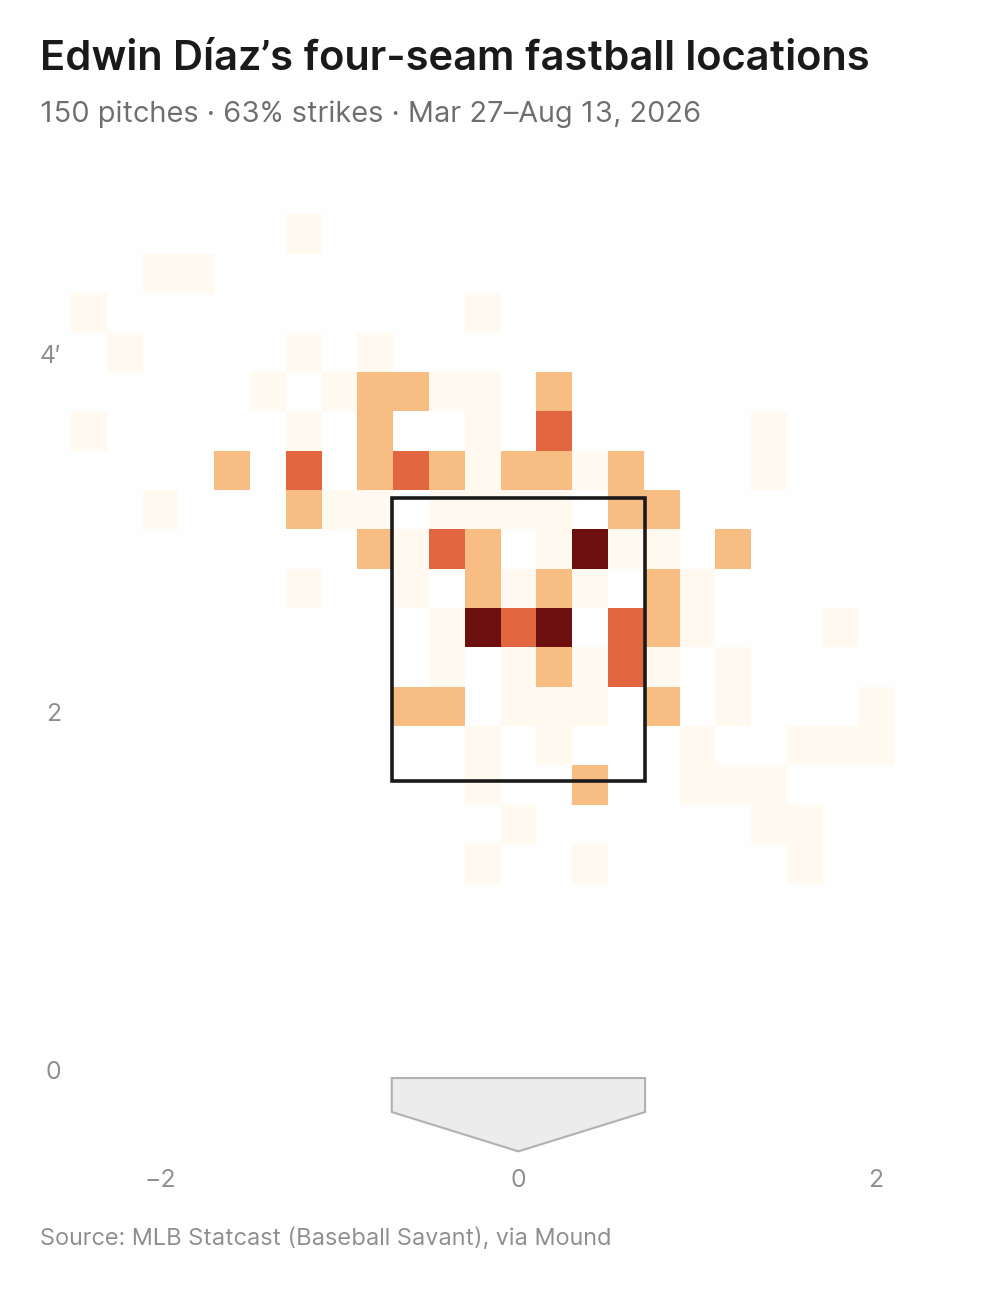
On Aug. 13, two-thirds of his fastballs were strikes by location. For the season through that game, fewer than half were. That gave Milwaukee more fastballs in the zone to swing at, though the locations alone cannot tell us where Díaz intended to throw them.
The chart for the Milwaukee game takes one command:
mound zone "Edwin Díaz" --game 823915 --pitch fastball --cache --out diaz_ff_aug13_zone.pngThe cost of the middle
The Aug. 13 singles weren’t the only examples. Five days earlier, Arizona’s Geraldo Perdomo and Corbin Carroll tripled on fastballs in the middle band. Both pitches crossed less than an inch from the horizontal center of the plate, at 96.5 and 98.6 mph.
Across the season sample, hitters put 10 of Díaz’s 27 middle-third fastballs in play. They swung and missed at just two. Those 27 pitches accounted for 18% of his fastballs but 10 of the 19 balls in play against the pitch.
| Fastball location | Pitches | Swing rate | Whiffs | Balls in play |
|---|---|---|---|---|
| Upper third | 30 | 46.7% | 4 | 3 |
| Middle third | 27 | 70.4% | 2 | 10 |
| Lower third | 13 | 30.8% | 0 | 1 |
| Outside the zone | 80 | 26.2% | 4 | 5 |
Hitters offered more often at the fastball in the middle, and seldom missed when they did. That supports Díaz’s concern about the location. Balls in play aren’t all damage, however: this table includes outs as well as hits.
Nor does the evidence point to a simple loss of velocity. His fastball averaged 96.5 mph against Milwaukee, compared with 97.0 across the four outings. Hitters missed on half their swings against each of his two pitches that night. Those are small samples, but the inning included missed bats as well as hittable fastballs.
His pitch mix changed little, either: 62.5% fastballs on Aug. 13, compared with 61.0% across the four appearances. That doesn’t settle whether he chose the right pitch in each count. It does mean the broad mix offers little explanation for the result.
The sliders complicate the diagnosis
Chourio singled on a slider outside the zone. Mitchell followed with a single on one at the bottom of it. The fastballs had helped create the trouble, but a fastball-location fix alone would not account for every hit in the inning.
That distinction matters in a sample this small. Fifteen fastballs can describe one night; they cannot establish a lasting command problem. Even the season comparison contains only 150, and includes the Milwaukee outing itself.
Díaz’s explanation holds up as a description of two costly fastballs. The rest of the inning is a reminder of how quickly a closer’s margin can disappear: two singles on fastballs in the middle, then two more on sliders somewhere else.
Reproduce the analysis
The companion script prints the location and outcome tables, exports the four outings, draws the Aug. 13 location chart and downloads the Hamilton single:
python examples/diaz_blown_saves.pyOutputs go to examples/output/. The script needs access to MLB’s Stats API and Baseball Savant. The numbers shown here are from the original analysis; upstream data corrections can change later results. The dates are fixed so later appearances do not enter the sample.
For an interactive session, retrieve the same four outings and the season comparison:
from mound import Pitcher

# MLB ID 621242 identifies the Dodgers pitcher; names work too.
diaz = Pitcher(621242)
last4 = diaz.pitches(since="2026-08-07", until="2026-08-13", cache=True)
season = diaz.pitches(season=2026, until="2026-08-13", cache=True)
The location calculation uses plate_z for pitch height and sz_bot and sz_top for the hitter’s zone. Pitches outside the zone are counted separately. These are geometric boundaries, not the umpire’s calls.
import pandas as pd


def height_bands(frame):
    f = frame.dropna(subset=["plate_x", "plate_z"]).copy()
    f["height_pct"] = (f["plate_z"] - f["sz_bot"]) / (f["sz_top"] - f["sz_bot"]) * 100
    f["band"] = pd.cut(
        f["height_pct"],
        [-float("inf"), 100 / 3, 200 / 3, float("inf")],
        labels=["low", "middle", "high"],
    ).astype(str)
    f.loc[~f["in_zone"].astype(bool), "band"] = "out of zone"
    return f


season_ff = height_bands(season.to_frame().query("pitch_type == 'four-seam fastball'"))
aug13_ff = season_ff[season_ff["game_date"] == "2026-08-13"]

print(pd.DataFrame({
    "Aug 13": aug13_ff["band"].value_counts(normalize=True).mul(100),
    "Season through Aug 13": season_ff["band"].value_counts(normalize=True).mul(100),
}).round(1))
To inspect velocity, movement and hitter responses, or export the underlying rows:
mound arsenal "Edwin Díaz" --since 2026-08-07 --until 2026-08-13 --cache
mound pitches "Edwin Díaz" --since 2026-08-07 --until 2026-08-13 --cache --export diaz_last4.csv
--cache reuses completed game feeds on later runs. Mound retrieves player identities and game logs from MLB’s Stats API and pitch measurements from Baseball Savant. Save and blown-save designations come from the game log, not from pitch measurements.
Watch the pitches
Download the Hamilton single by its position in the game, or the two Arizona triples by their pitch IDs:
mound video "Edwin Díaz" --game 823915 --at-bat 68 --pitch-number 5 --cache --out-dir clips
mound video-id a08dfb7d-1acd-3776-a6d8-0f5e80cdb0c6 --out clips/perdomo_triple_aug8.mp4
mound video-id 13f4b8d1-39f4-3499-b696-8a3311899fde --out clips/carroll_triple_aug8.mp4
A useful next question is whether location changed by count or batter handedness. The exported table includes both; the Python API can narrow the same collection without downloading the games again.
Run it yourself
This walkthrough lives in the repo as docs/examples/diaz-blown-saves.md, with a runnable companion script in examples/.